AI Powered Animated Infographics to Craft Vivid Data Visualizations
Share your data and content ideas. AI completes layout arrangement and dynamic design automatically. You can get polished visual works easily through simple dialogue.
Diverse AI Visual Styles for Infographic Creation
Match proper layout styles according to actual data presentation needs

Classic Flat Data Style
Neat flat layouts with standard charts, ideal for formal business data display.
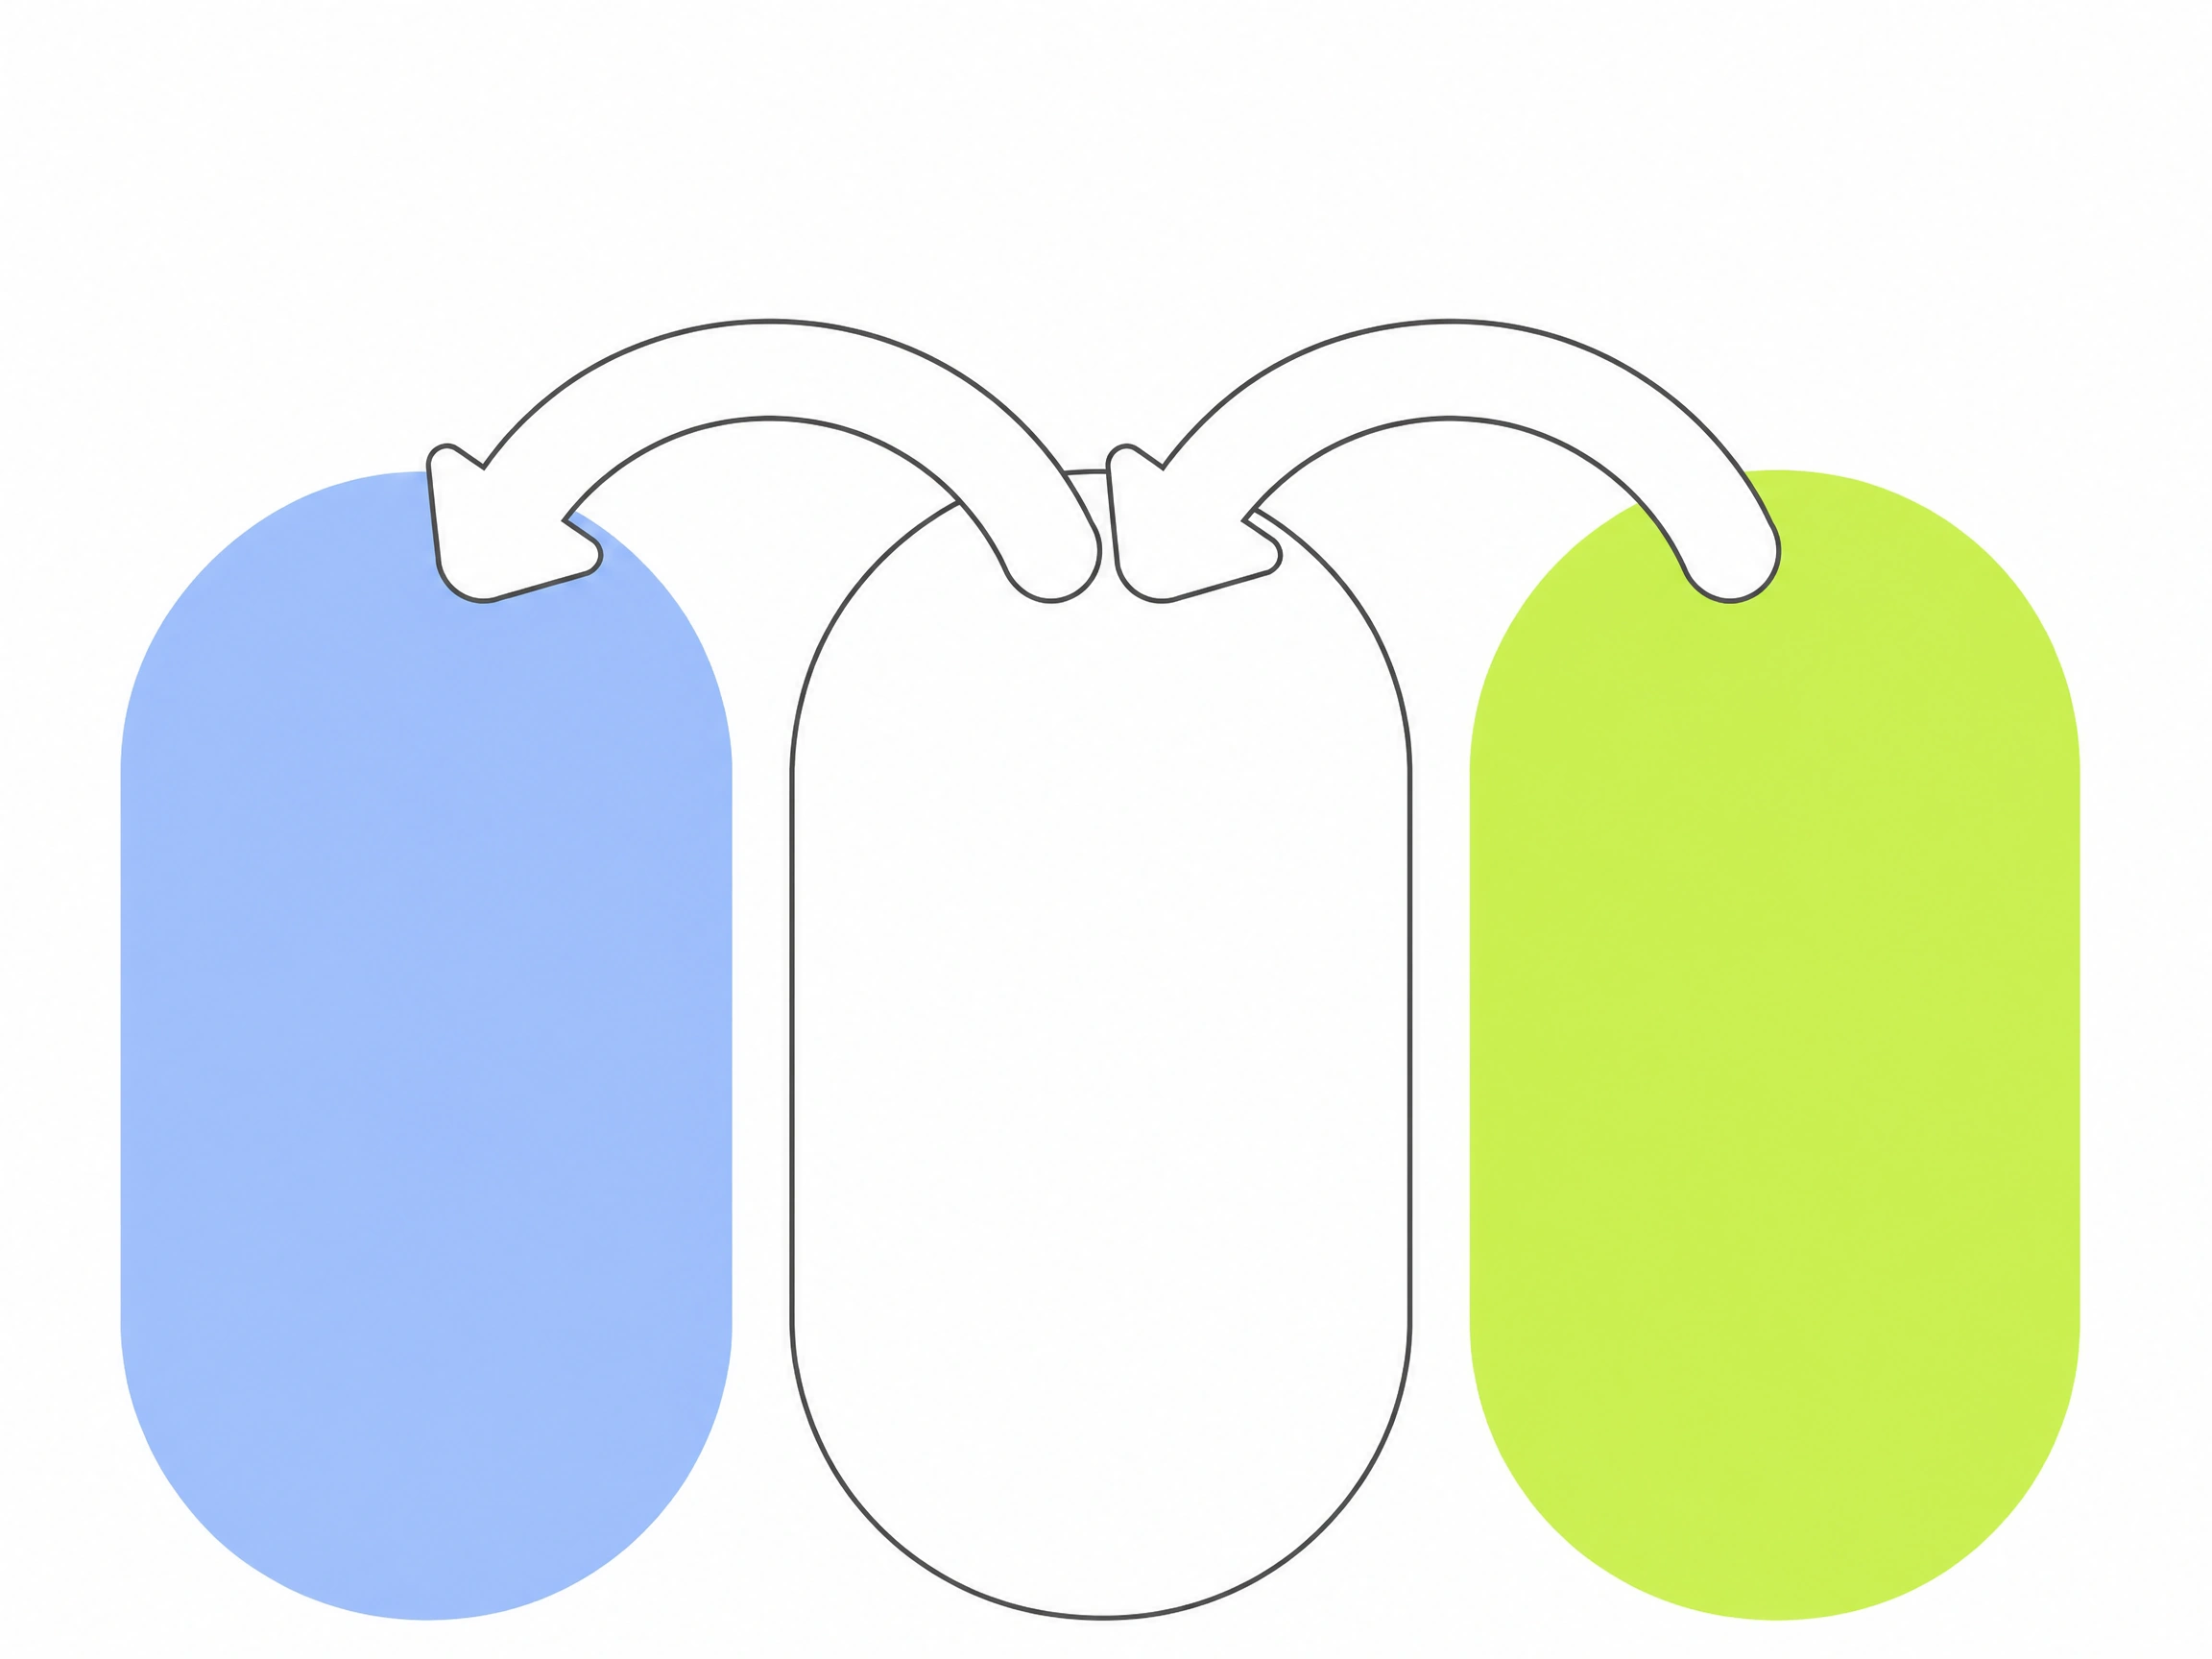
Story-driven Visual Layout
Arrange data content in logical scenes to deliver information clearly to audiences.
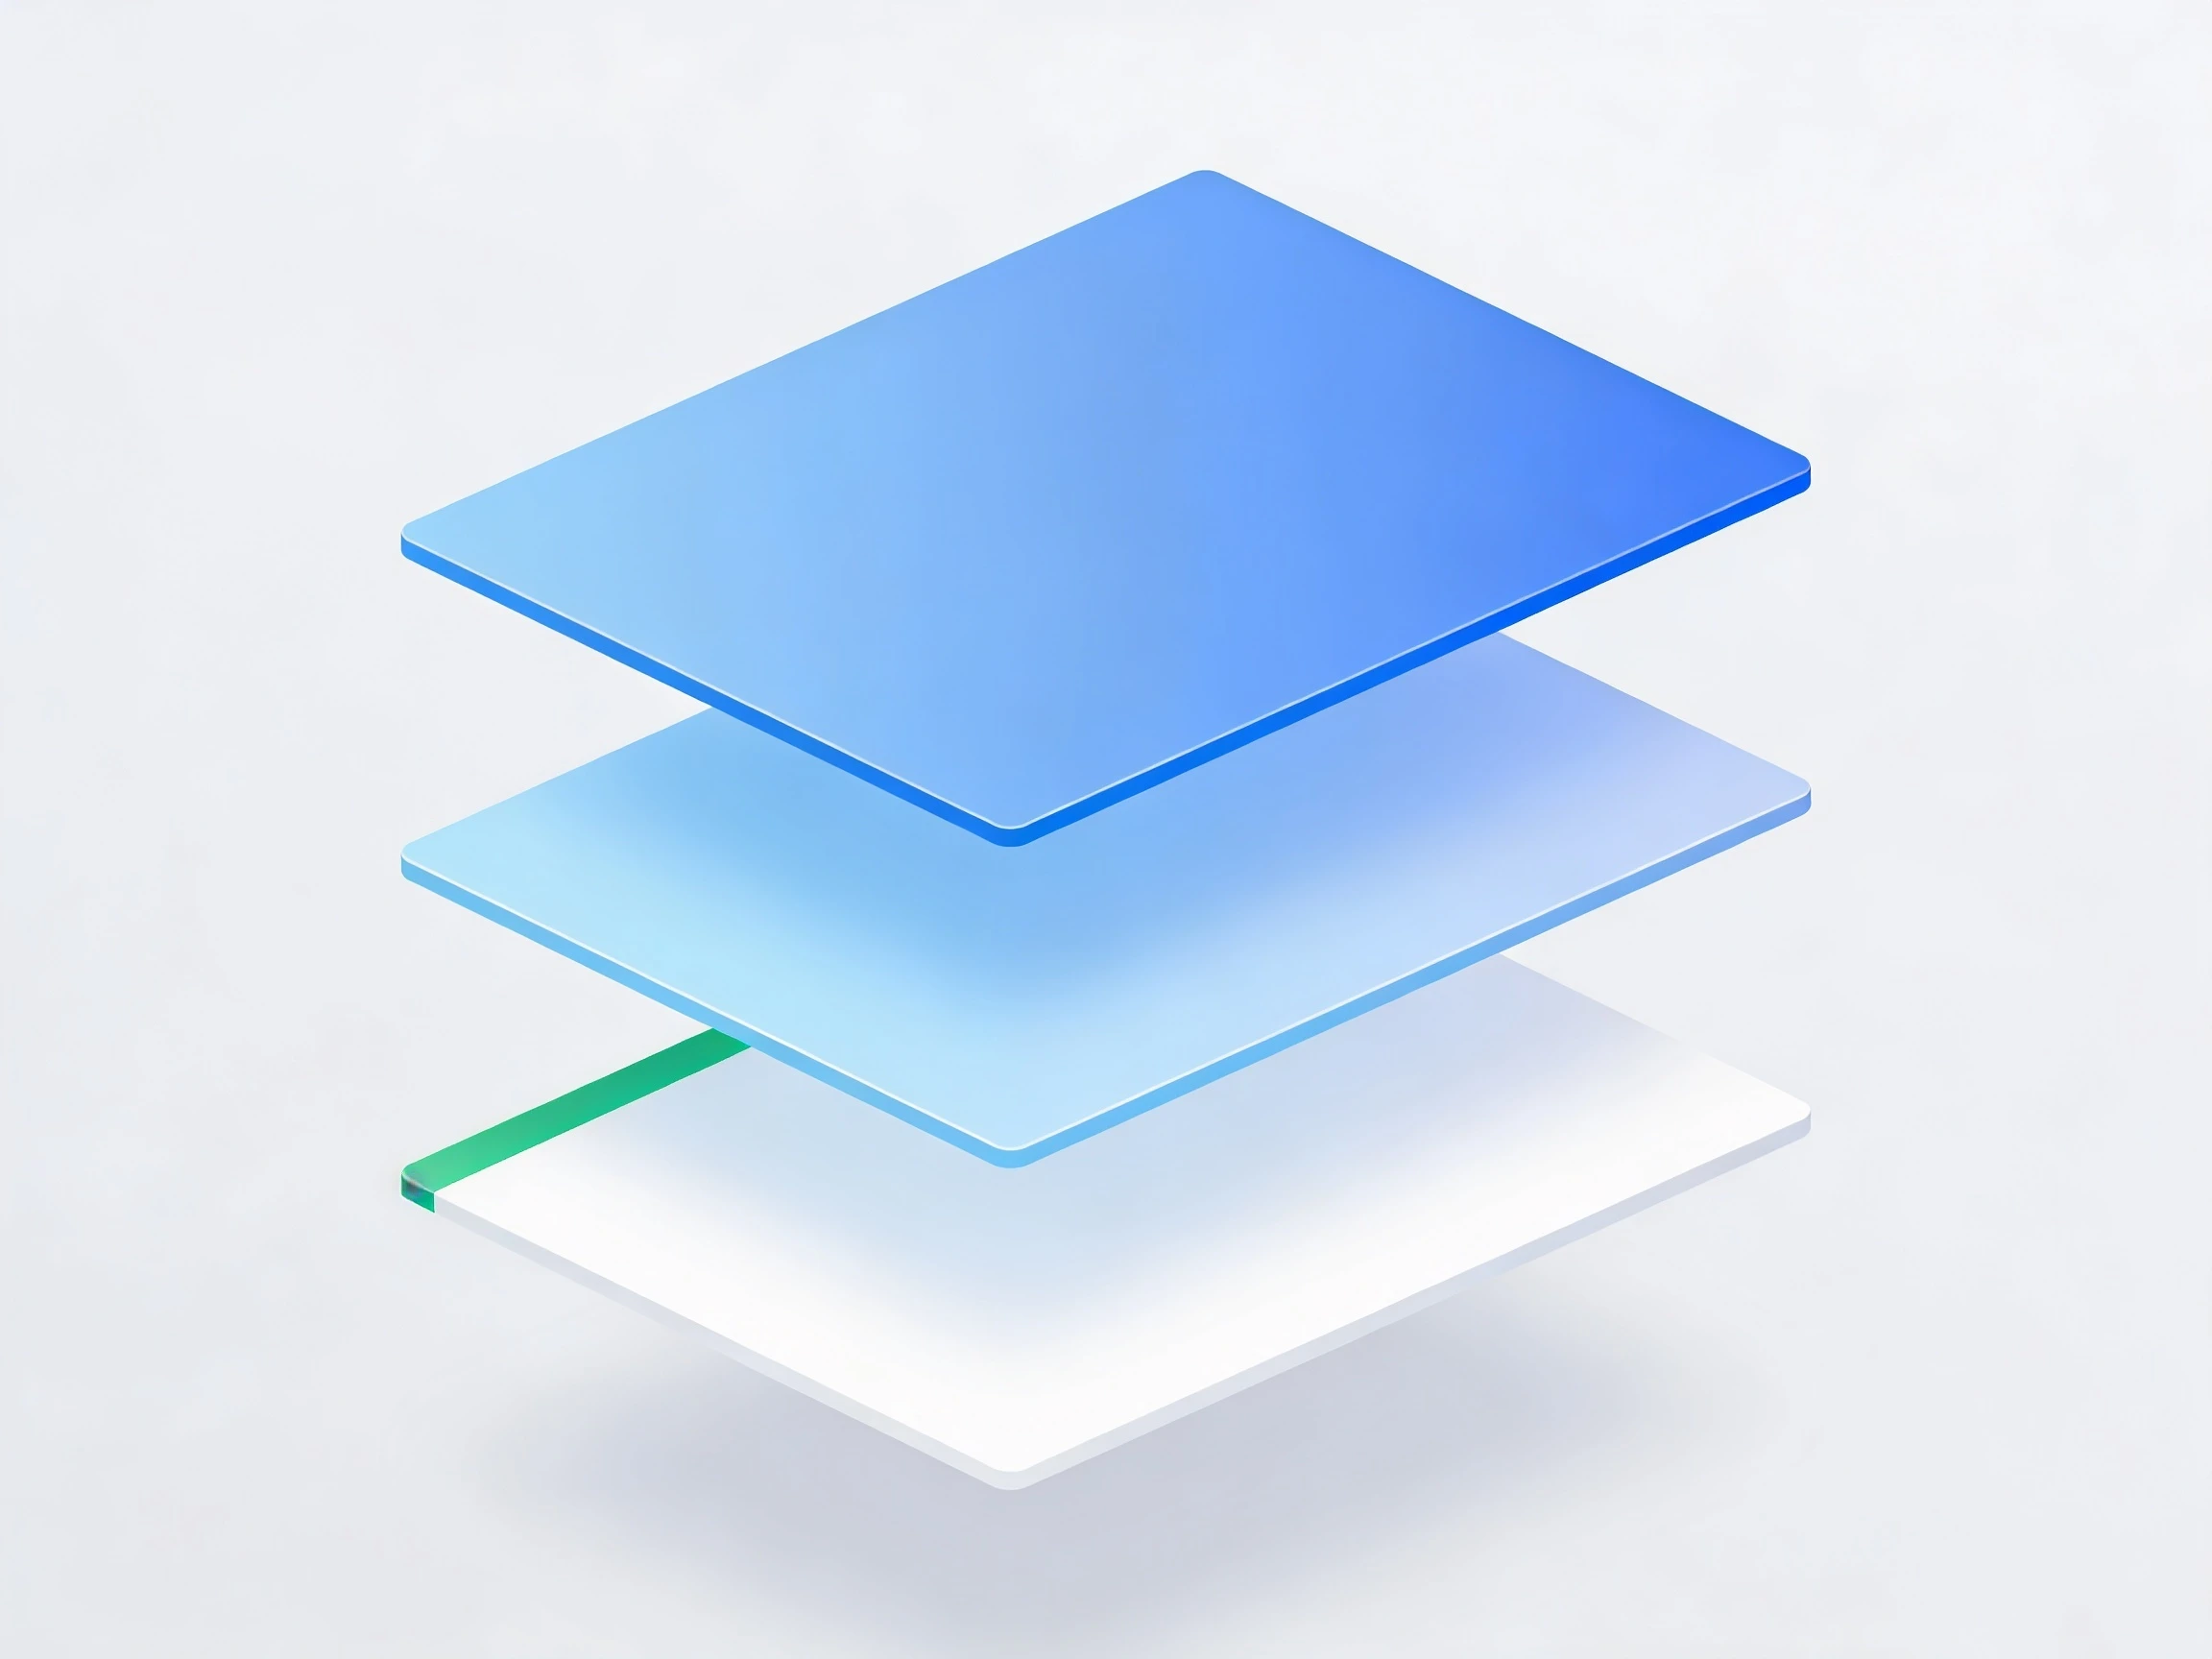
Stereo Dimension Visuals
Add layered three-dimensional effects to make statistical content more striking.

Hand-drawn Sketch Infographic
Soft handcrafted tones fit casual sharing and educational content presentation.

Focused Data Motion Design
Highlight core figures and data changes with concise dynamic transitions.
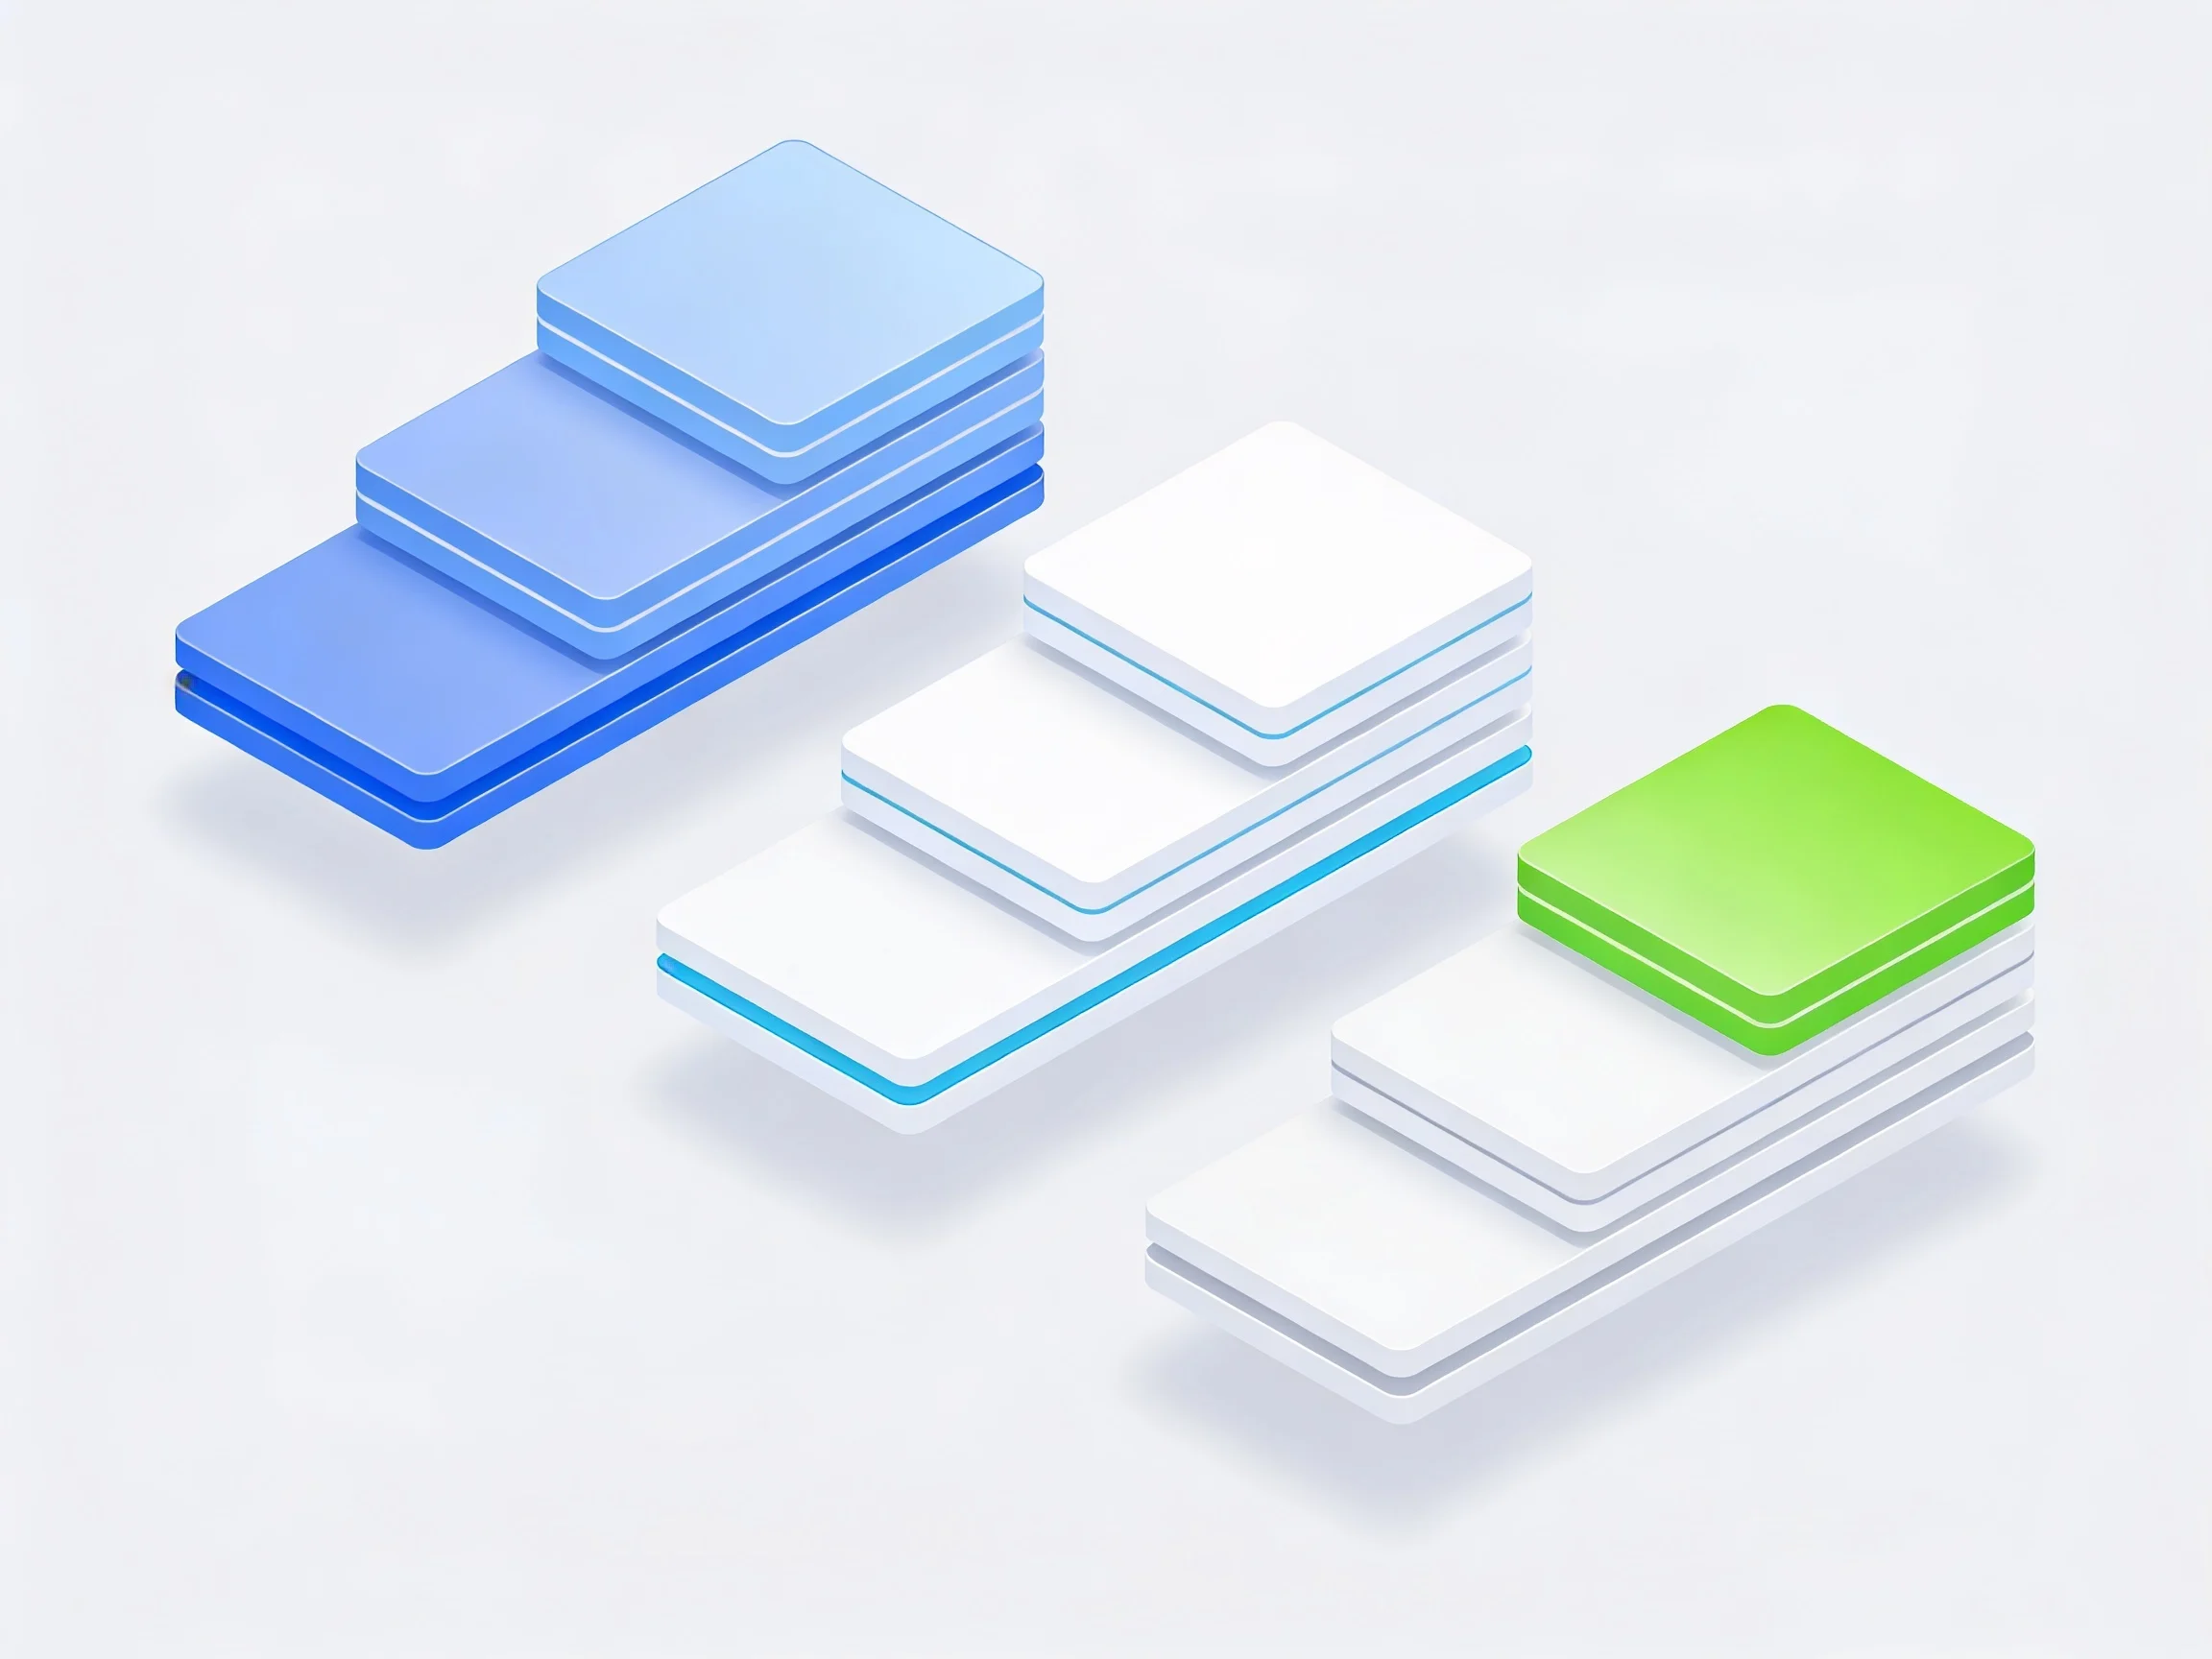
Isometric Hierarchy View
Classify multi-group information with 2.5D layout for orderly content sorting.
Boost Data Visual Creation with AI Partner
Accelerate content output and elevate professional presentation quality
Easy Layout Planning
Quickly build logical content frameworks without tedious manual drafting
Consistent Brand Styling
Keep color schemes and visual styles aligned with corporate brand standards
Diversified Graphic Resources
Equip abundant charts and icons to fit all kinds of data themes
Global Text Compatibility
Adjust text versions freely to suit diverse regional presentation scenarios
Smart Dynamic Tuning
Generate natural flowing animations that highlight key data information
Flexible Label Design
Easily adjust captions and data labels to fit different display platforms
Four Simple Steps to Make Animated Infographics
Craft professional data visuals with effortless operations
Input Core Content
Put together your key data and preferred display ideas
Check Live Previews
Observe overall layout and animated effects instantly
Refine Visual Details
Adjust charts, layouts and animations to your preference
Ship it
Get finished visuals ready for presentation and sharing
Built for the Way You Actually Work.
Different teams. Different videos. Pexo speaks every industry's language.

Business Operation Teams
Produce operational indicator charts and internal business data summaries

Finance & Commercial Fields
Present profit analysis reports and industry market trend visuals

Education & Training Sectors
Design teaching data collations and learning outcome display graphics
Startup Entrepreneur Teams
Sort out project data and make neat business introduction visuals
What You Can Create With Pexo
No prompt writing. No model picking. Just describe what you want.
2D Explainer Video
Character-led 2D animations that explain your product story
Whiteboard Animation
Sketch-style videos for tutorials, pitches, and training
Motion Graphics
Fully animated motion graphics without After Effects
Trusted Feedback from Industry Practitioners
Numerous professional teams rely on this tool for data visualization
"It cuts down much time spent on designing traditional data demonstration works."

SaaS Founder
"The finished animated infographics perfectly match our formal business presentations."

Insurance Product Manager
"Intelligent visual matching helps our team maintain unified content style easily."

Startup Founder
Frequently
Asked
Questions
What types of infographics can be generated?
It covers common data visualization content for business and office scenarios.
Is professional design skill necessary?
Anyone can finish complete works via simple daily operations.
Which file formats are available for export?
It supports mainstream common formats suitable for sharing and office use.
Can users save preferred visual styles?
You can set your own custom styles and keep them applied steadily within the same project creation process.
Does it support formal business scene use?
It offers plenty of neat and professional design styles, which work perfectly for all kinds of official meetings and business presentations.
Can I adjust data display emphasis freely?
You can freely highlight key data content and adjust visual focus according to your actual needs by just chatting with Pexo.
What Pexo Can Do For You
-
Text to Video
Turn any text into a polished video
-
Image to Video
Turn your image into a video
-
URL to Video
Paste a link, get a finished video
-
Text to Image
Describe your idea, get a stunning image
-
Audio to Video
Visualize your audio and music
-
Script to Video
Turn written draft into a fully produced video
-
AI Music Generation
Generate music based on description
-
AI Image Generation
Generate AI images from text or image
-
Lip Sync
Studio-Grade AI Lipsync Dubbing